> ## Documentation Index
> Fetch the complete documentation index at: https://slidely.ai/docs/llms.txt
> Use this file to discover all available pages before exploring further.
# AI Infographics
> Create stunning infographics from content
In this article, you'll learn how to create infographics from your slide content using the Infographics wizard.
## Step 1
Open the Infographics Wizard
 ## Step 2
Select Your Content
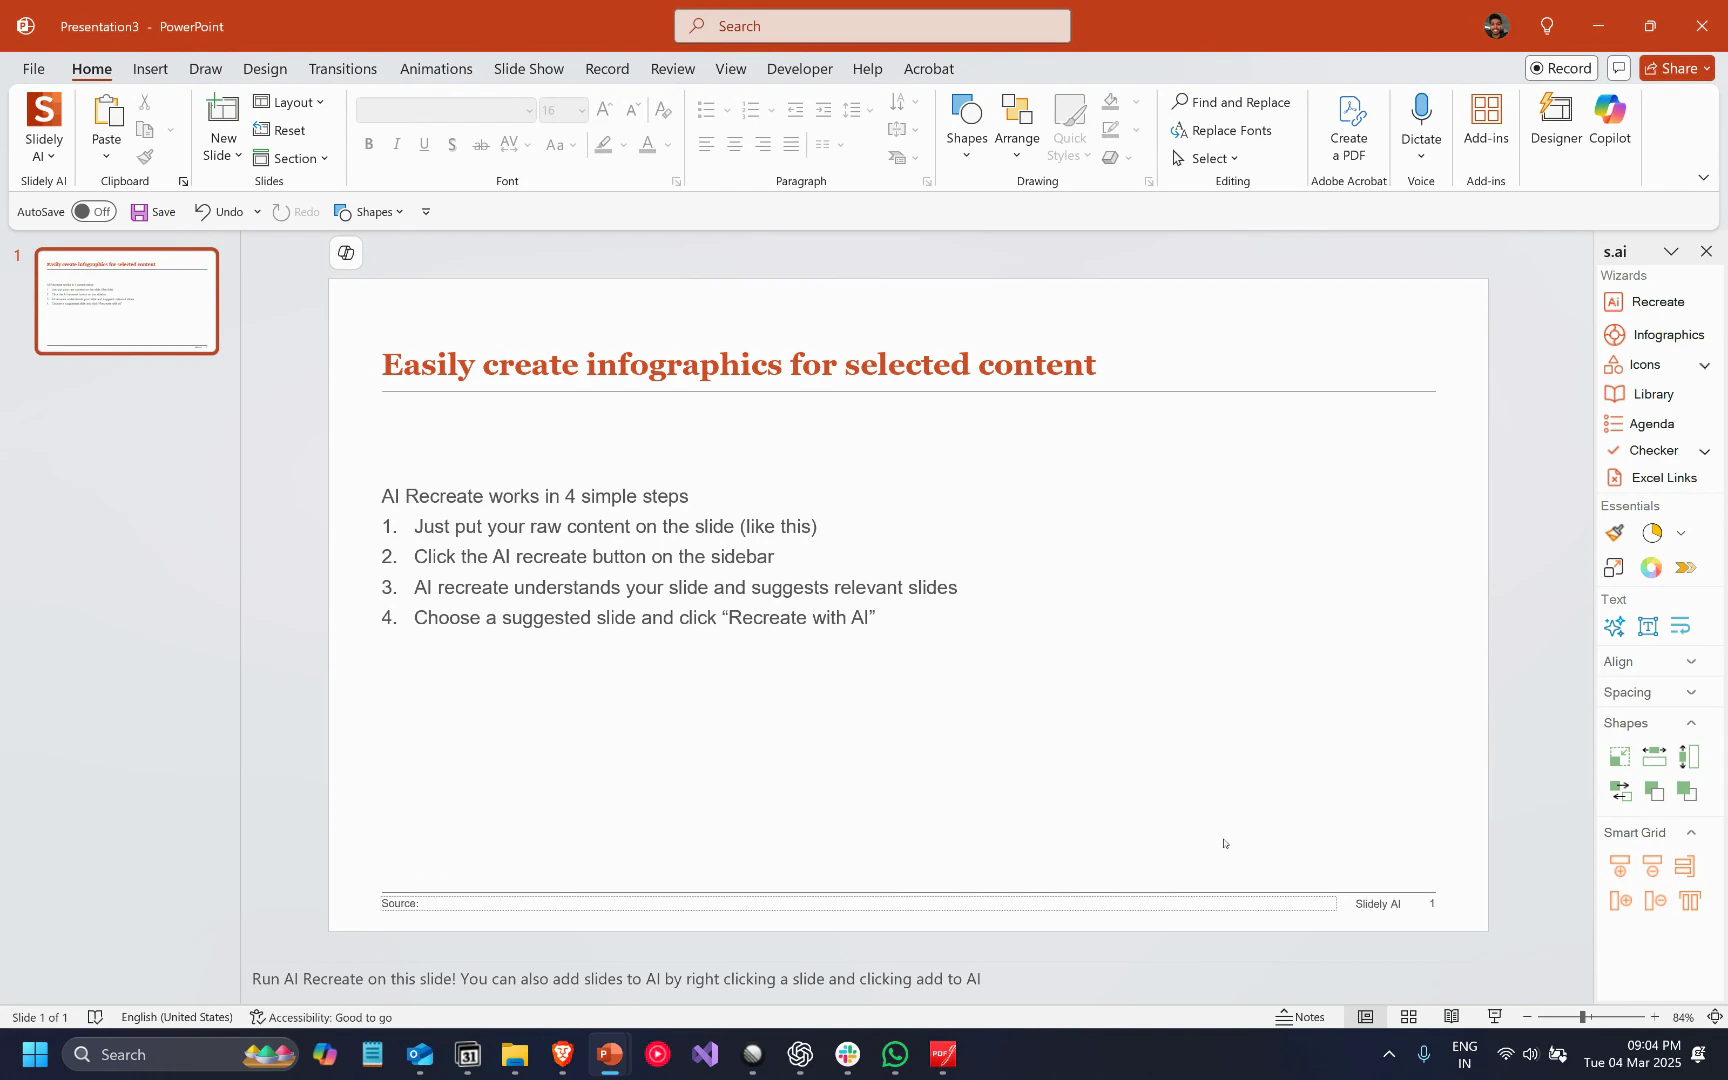
Choose the content on your slide that you want to convert into an infographic. For this tutorial, we're using a text that outlines a four-step process.
## Step 3
Generate Your Infographic
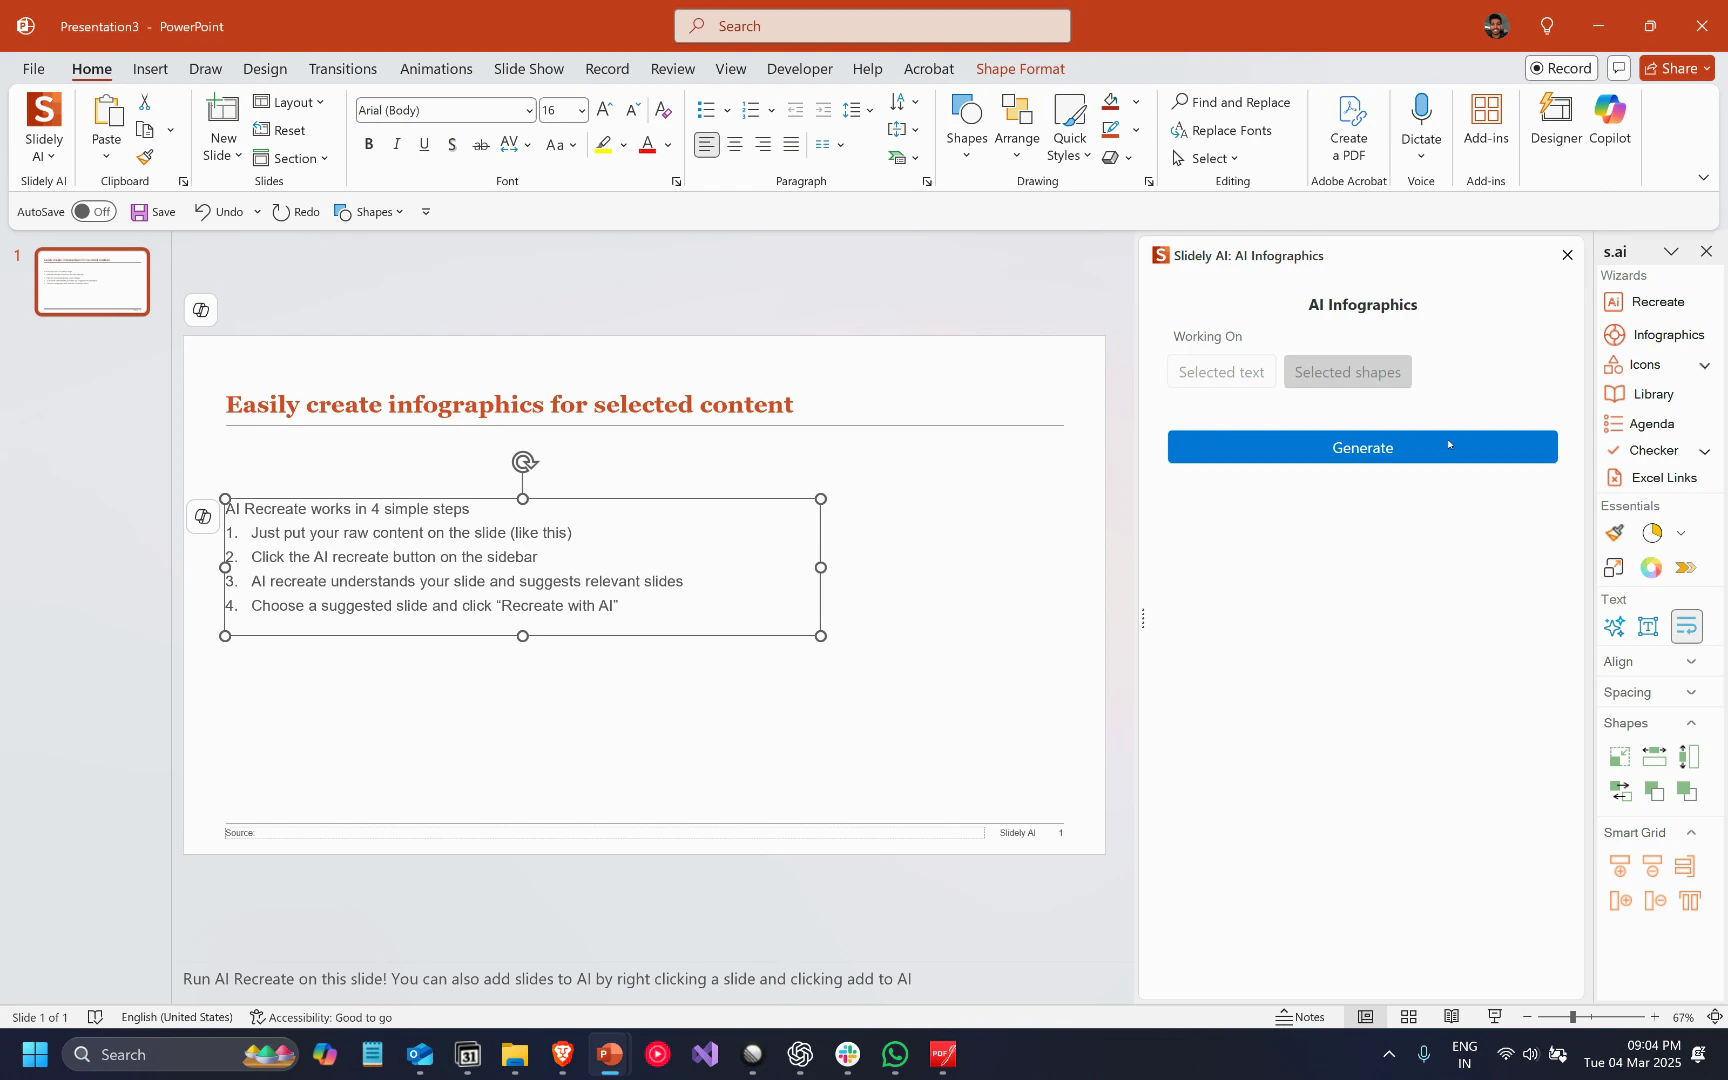
On the taskpane, click Generate.
The wizard will analyze your content and generate infographics that match your company's branding.
## Step 2
Select Your Content
Choose the content on your slide that you want to convert into an infographic. For this tutorial, we're using a text that outlines a four-step process.
## Step 3
Generate Your Infographic
On the taskpane, click Generate.
The wizard will analyze your content and generate infographics that match your company's branding.
 ## Step 4
Preview and Insert Your Infographic
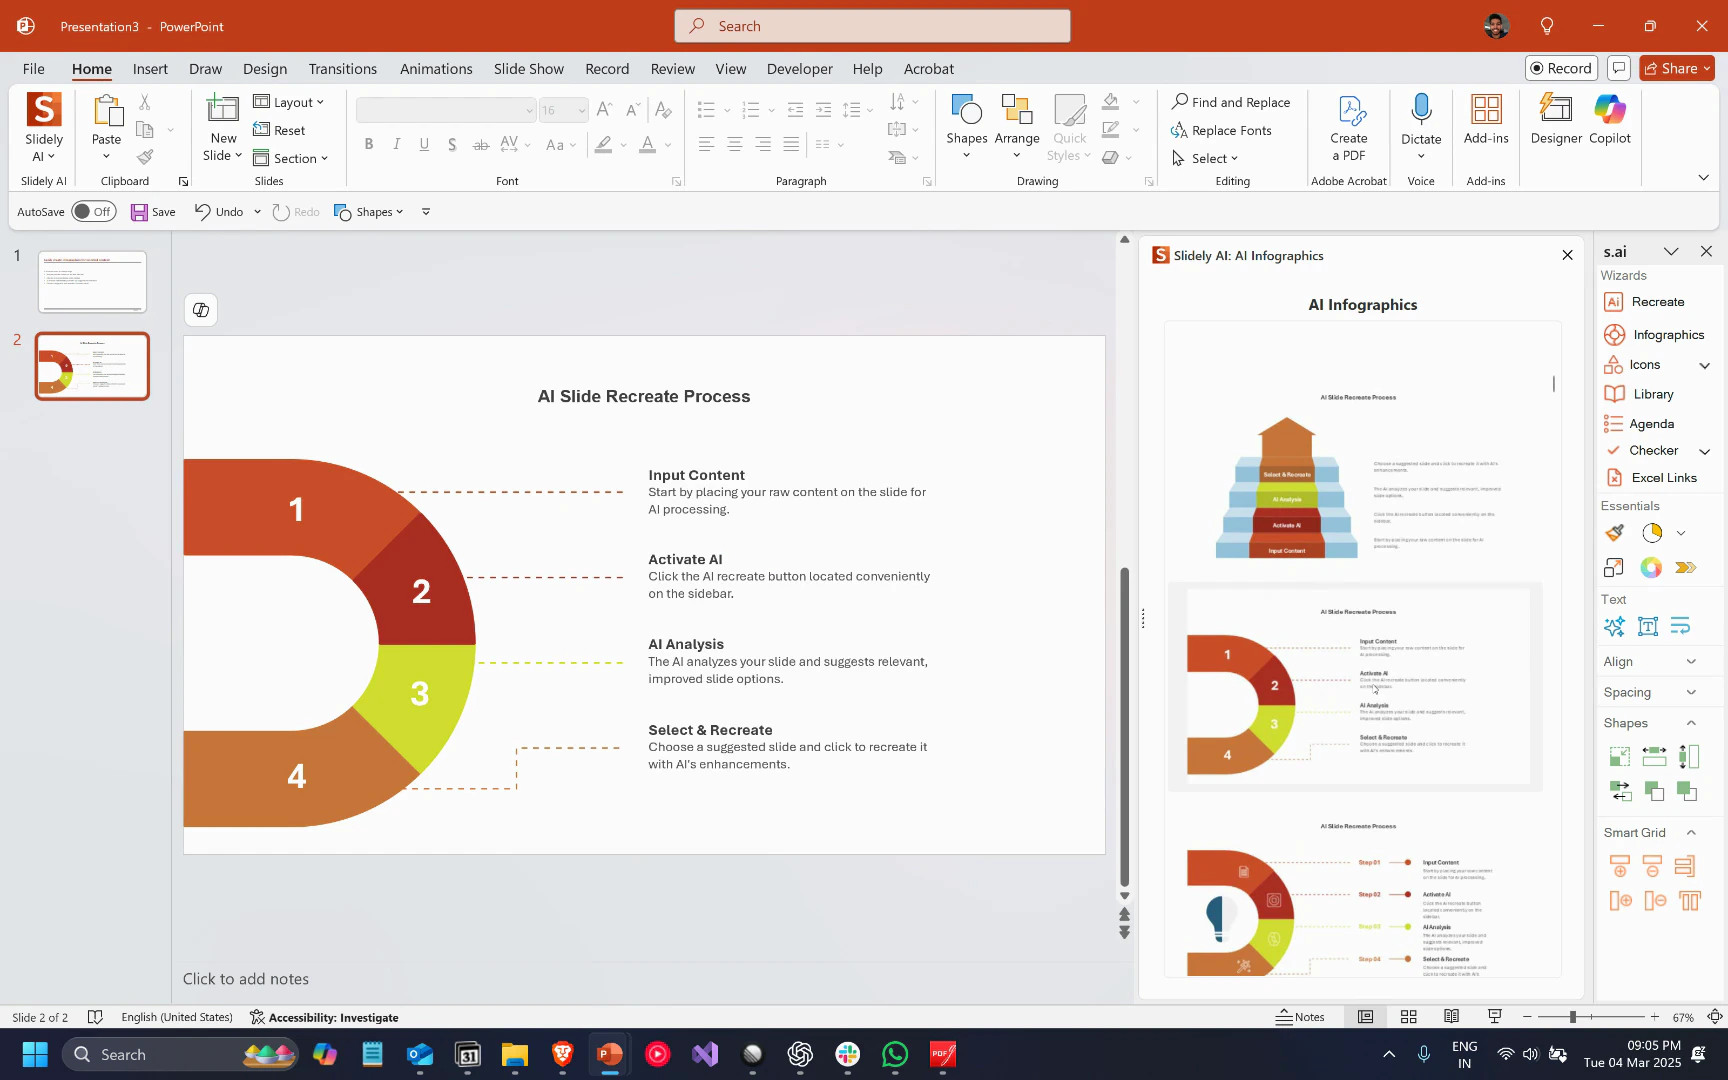
You'll be able to preview the generated infographics and insert the one you prefer. When you click on an infographic, it'll show a preview on a new slide without modifying the existing one. You're free to switch between different infographics to see what they look like.
Note that the wizard automatically selects relevant icons and ensures all infographics align with your color scheme.
## Step 4
Preview and Insert Your Infographic
You'll be able to preview the generated infographics and insert the one you prefer. When you click on an infographic, it'll show a preview on a new slide without modifying the existing one. You're free to switch between different infographics to see what they look like.
Note that the wizard automatically selects relevant icons and ensures all infographics align with your color scheme.